TL;DR — Quick Setup Checklist
|
Modern coherent optical systems cannot be validated with power levels and eye diagrams alone. When modulation formats such as QPSK, 16-QAM, or 64-QAM are used, both amplitude and phase integrity must be verified. That requirement leads many engineers to the optisystem constellation visualizer component—often after encountering distorted clusters, rotating symbols, or unreadable “spider web” patterns in simulation.
Inside OptiSystem, this component serves as a primary diagnostic tool for I/Q-modulated signals. However, correct placement, sampling configuration, normalization, and DSP alignment are critical. Even small setup errors can make a healthy system appear broken.
This guide explains where to find the component, how to configure it properly, how to troubleshoot distorted constellations, and how to interpret results like a practicing optical systems engineer.
What Is OptiSystem Constellation Visualizer Component?
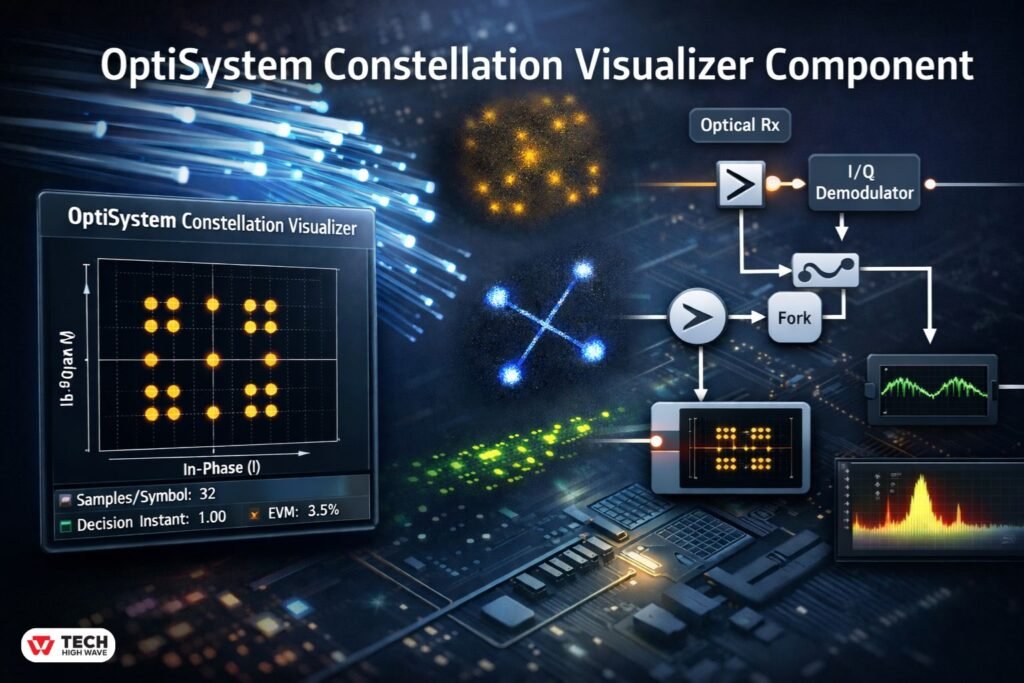
The optisystem constellation visualizer component is a graphical analysis tool that plots digitally modulated symbols on an in-phase (I) and quadrature (Q) plane. Each point represents a received symbol after transmission, detection, and processing.
Unlike an eye diagram, which operates in the time domain, a constellation diagram operates in the symbol domain. It reveals:
- Phase noise
- I/Q imbalance
- Amplitude distortion
- Frequency offset
- Nonlinear impairments
- DSP performance limitations
When a system performs correctly, symbol clusters appear tight and centered around ideal decision points. When impairments exist, clusters spread, rotate, elongate, or scatter.
Where Is It Located?
Many users search specifically for the component path. It is found under:
- Visualizers Library > Electrical
- Visualizers Library > Optical
Use the electrical version after photodetection and coherent demodulation. Use the optical version when analyzing optical field components directly.
Electrical vs Optical Constellation Visualizer
| Aspect | Electrical Version | Optical Version |
| Signal Type | Post-detection I/Q signals | Optical field components |
| Typical Placement | After coherent receiver | Before photodetector |
| Best For | DSP validation, BER correlation | Optical field analysis |
| Common Use | QPSK, QAM coherent systems | Pre-detection impairment study |
Choosing the wrong version results in misleading outputs or invalid measurements.
How OptiSystem Constellation Visualizer Component Works
The component receives I and Q signal inputs and maps them onto a Cartesian plane. Each symbol sample becomes a point in the I/Q grid.
Conceptual Signal Flow
- Digital transmitter generates modulated data.
- Signal propagates through fiber, amplifiers, filters.
- Coherent receiver extracts I and Q components.
- Equalization and carrier recovery may process signals.
- Constellation visualizer plots symbol samples.
Tight clustering indicates good signal quality. Broad or rotated clustering signals degradation.
Critical Technical Configuration Details
-
The Fork Requirement (Signal Splitting)
Directly inserting the visualizer into the main signal path may interrupt the connection to the decoder.
To prevent this:
- Insert a Fork component, or
- Use a Dual Port Monitor
One branch continues to the decoder. The other connects to the constellation visualizer. This preserves signal integrity and prevents simulation errors.
-
Samples per Symbol & Decision Instant
Improper sampling is the most common cause of messy constellation plots.
If the Decision Instant is incorrect, the visualizer captures symbol transitions rather than steady-state samples. The result appears as circular smears or transition streaks.
Recommended practice for coherent systems:
- ≥16 samples per symbol
- Confirm global simulation sampling rate
- Set Decision Instant after equalization
In practical simulations, constellation distortion often appears immediately after DSP parameter adjustments. Verifying the sampling point typically resolves the issue.
-
Normalization Settings
If constellation points appear:
- Extremely small
- Off-center
- Outside the visible grid
Normalization must be adjusted.
Within component properties, scale I/Q amplitudes to 1 (normalized reference). This ensures consistent comparison across modulation formats and simulation runs.
Also Check: Konversky in 2026: The Smarter, Trust-Driven Alternative to Traditional CRO
Step-by-Step: How to Add and Connect the Component
- Open the Visualizers Library.
- Select Electrical or Optical Constellation Visualizer.
- Drag it into the layout.
- Insert a Fork or Dual Port Monitor at the desired measurement point.
- Connect one branch to the decoder.
- Connect the second branch to the visualizer input.
- Verify samples per symbol in global simulation settings.
- Open visualizer properties.
- Confirm Decision Instant.
- Adjust normalization if required.
- Run the simulation.
Proper integration eliminates the majority of configuration errors.
Troubleshooting Distorted Constellations
Symptom-Based Diagnostic Table
| Symptom | Likely Cause | Recommended Fix |
| Circular smear | Incorrect Decision Instant | Adjust sampling point |
| Rotated constellation | Frequency offset | Enable carrier recovery |
| Wide scatter | Low OSNR | Improve amplifier spacing |
| Elongated clusters | Chromatic dispersion | Adjust dispersion compensation |
| No visible points | Wrong visualizer type | Verify electrical vs optical |
Most issues stem from configuration rather than fundamental design failure.
Interpreting Constellation Patterns
Understanding cluster shape provides insight into system impairments:
- Uniform spreading → ASE noise dominance
- Diagonal stretching → I/Q imbalance
- Circular blur → Phase noise or laser linewidth issues
- Rotational drift → Frequency offset
- Cluster splitting → Nonlinear distortion
In coherent systems, constellation analysis often reveals problems before BER significantly increases.
Constellation Diagram vs Eye Diagram
| Feature | Constellation Diagram | Eye Diagram |
| Domain | Symbol (I/Q) | Time |
| Detects | Phase + amplitude errors | Timing jitter |
| Best For | QAM, QPSK | OOK, NRZ |
| DSP Validation | Yes | Limited |
Eye diagrams are insufficient for phase-sensitive modulation formats.
Correlation Between Constellation and BER
Tight clusters generally correlate with low bit error rates. However:
- Rotated constellations may still yield acceptable BER after correction.
- Mild spreading may precede BER degradation.
- Severe cluster overlap usually predicts rapid BER increase.
Constellation analysis should complement, not replace, BER measurement.
Best Uses for OptiSystem Constellation Visualizer Component
The component is especially valuable in:
- Coherent DWDM system simulation
- 100G/400G/800G transmission analysis
- DSP equalization testing
- Laser linewidth studies
- Nonlinear impairment research
- Probabilistic constellation shaping experiments
It is less necessary for simple OOK-based intensity modulation systems.
Parameter Reference Guidelines
Typical coherent simulation settings:
| Parameter | Recommended Range |
| Samples per symbol | 16–64 |
| Sequence length | ≥1024 symbols |
| Laser linewidth | ≤1 MHz (lab models vary) |
| OSNR | ≥15 dB for clean clustering |
| Equalizer taps | Based on dispersion level |
Exact values depend on link design, but these ranges provide a stable starting point.
Who Should Use OptiSystem Constellation Visualizer Component?
Primary Users
- Optical communication engineers
- Telecom R&D teams
- Signal processing researchers
- Graduate photonics students
Limited Benefit For
- Basic analog optical simulations
- Low-speed OOK systems
- Projects without phase-sensitive modulation
How to Choose the Right OptiSystem Constellation Visualizer Component
Consider:
- Measurement point (optical vs electrical)
- DSP stage placement
- Sampling resolution
- Need for EVM-style interpretation
- Comparison across simulation runs
For final performance evaluation, place the visualizer after equalization and carrier recovery.
Understanding EVM in Constellation Analysis
Error Vector Magnitude (EVM) quantifies how far received symbols deviate from ideal reference points. While the constellation visualizer primarily provides graphical output, tight clustering generally indicates low EVM.
In advanced coherent analysis, EVM provides a numerical complement to visual inspection.
Common Mistakes to Avoid
- Skipping the Fork component
- Misplacing the visualizer before equalization
- Using insufficient sampling resolution
- Ignoring frequency offset
- Forgetting normalization
- Comparing constellations without consistent scaling
Small configuration errors often produce misleading visual results.
Future Trends (2026 Outlook)
As modulation formats become denser and probabilistic shaping gains adoption, constellation visualization tools are evolving to support:
- Higher resolution density mapping
- Improved integration with EVM metrics
- Enhanced DSP performance visualization
- Advanced clustering analysis for high-order QAM
With coherent transmission exceeding 800G in modern simulations, accurate constellation analysis remains central to system validation.
Frequently Asked Questions
Q1: Where is the optisystem constellation visualizer component located?
It is found under Visualizers Library > Electrical or Visualizers Library > Optical inside OptiSystem.
Q2: Why does the constellation look like transition lines instead of points?
The Decision Instant is likely misconfigured, causing sampling during symbol transitions.
Q3: Is a Fork component necessary?
Yes. A Fork or Dual Port Monitor allows signal splitting without interrupting the decoder path.
Q4: Why is the constellation rotated?
Frequency offset or phase drift causes rotation. Carrier recovery corrects it.
Q5: Why are the constellation points very small?
Normalization scaling may need adjustment within component properties.
Q6: Does constellation quality always predict BER?
Not always. Moderate distortion may still yield acceptable BER depending on correction algorithms.
Q7: Is the optical or electrical version better?
Neither is universally better; selection depends on measurement stage in the signal chain.
Final Note
The optisystem constellation visualizer component remains a foundational diagnostic instrument in coherent optical system design. When properly configured with correct sampling, normalization, signal splitting, and DSP placement, it provides precise, decision-ready insight into modulation integrity and overall system performance.
Also Read: Grecom PSR 800 Software Upgrades: 2026 Definitive Guide, Whistler Conversion & Firmware Breakdown